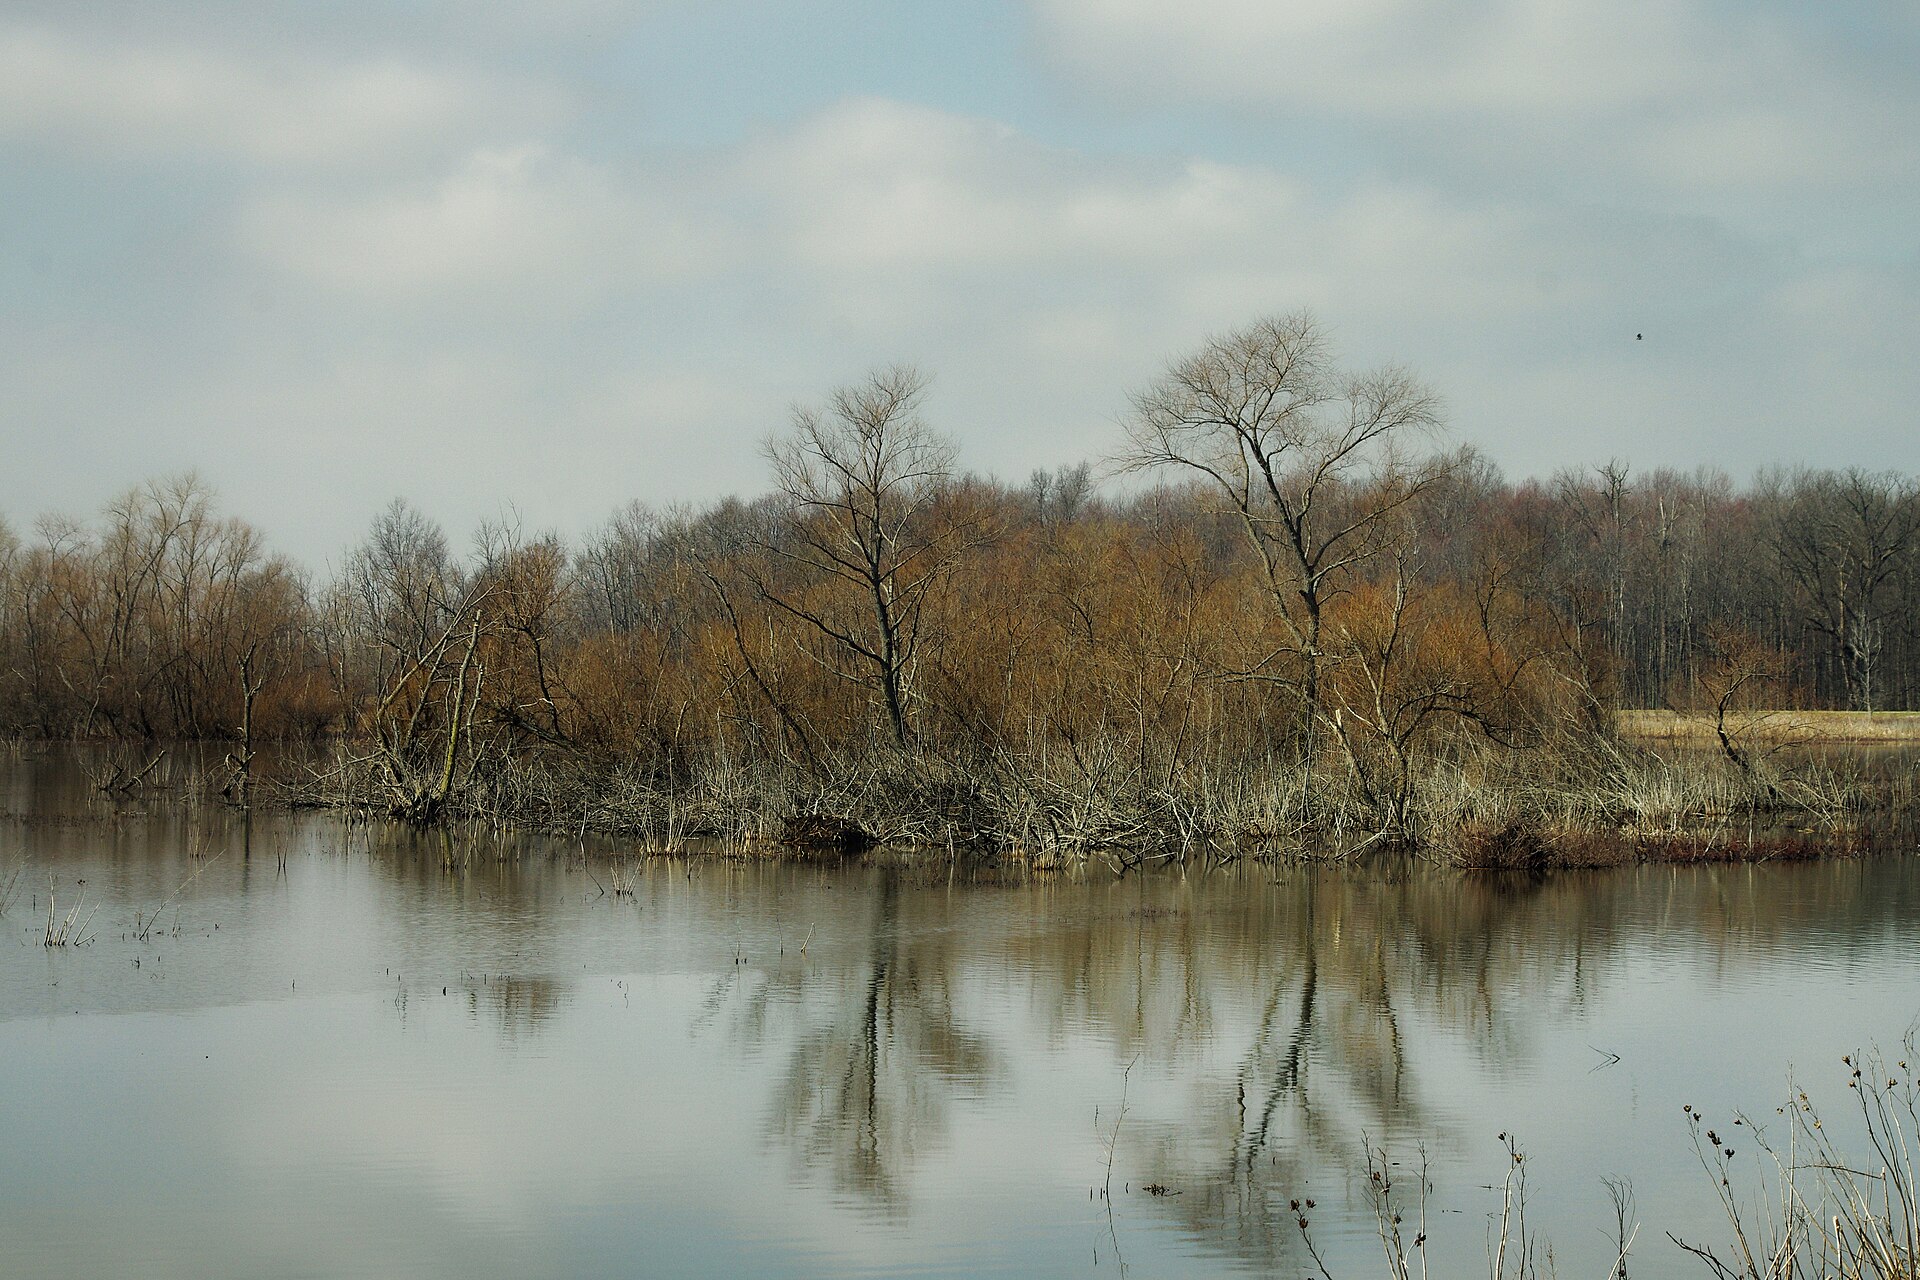
An imaging sonar aimed across a single narrow passage does not care whether the water is clear, whether the sun is up, or whether a fish is too small to hit a net panel. It counts what swims past. Pointed at the channel linking a restored 10-hectare wetland pool to Crane Creek on the southern shore of western Lake Erie, that instrument accumulated 2,022 hours of usable recordings across 56 separate deployments over four years — and in those hour-long slices of acoustic video, U.S. Geological Survey researchers tallied 3,436,118 fish detections moving into and out of the reconnected wetland, according to a study published in Aquatic Ecosystem Health & Management and posted by the USGS.
The wetland sits inside Ottawa National Wildlife Refuge near Oak Harbor, Ohio, one of the diked pools that survive along a shoreline where the historic Great Black Swamp marsh complex was almost entirely drained, leveed, and farmed. When one of those pools was reopened to the lake through a managed connection to Crane Creek, the obvious question was whether Lake Erie’s fish would actually use it — and how fast, how often, and in which direction. The long count, assembled by a Great Lakes Science Center team including Kurt P. Kowalski, Alexandra A. Bozimowski, McKenzie K.H. Smith, Michael R. Eggleston, Maxwell F. Ramsay, and Holly J. Eschenburg, answers that in units of hours and detections rather than impressions.
Why sonar, and why at that passage
Western Lake Erie’s nearshore water is famously difficult to see through. Sediment resuspended by wind fetch across a shallow basin, plus nutrient-driven algal production, means a diver or a camera can lose the target within a body length. Traditional fisheries gear works around that opacity rather than through it: trap nets set for 24 hours integrate a full day into one number, seines and electrofishing runs sample a moment, and visual surveys depend on light the water does not always provide. All of them are also labor-intensive at a site that is hard to reach and easy to disturb.
The problem is that fish movement through a reconnected wetland is not a daily average. It is a flux — pulses that can build and collapse inside an hour as light, wind, temperature, and water level shift, and as fish move to spawn, forage, or shelter. Averaging that flux hides exactly the behavior managers need to see. So the USGS team used high-resolution acoustic imaging sonar, the class of instrument that renders swimming animals as bright moving traces against a fan-shaped beam, and set it to watch the passage continuously. Each processed file is an hour-long echogram: a rolling record of every target crossing the beam, with direction of travel preserved, independent of turbidity and independent of whether it was noon or midnight.
That design converts an ecological question into a counting problem. Instead of asking whether fish appear in a net lift, the study asks how many targets crossed a defined line in the water, in which direction, in each hour of a four-year record. Processed hours skewed slightly toward daylight — roughly 1,002 daytime echograms against 529 nighttime and 491 crepuscular files — a sampling detail the paper carries forward rather than smoothing away.
The four-year count
Between 2011 and 2014, the 2,022 hours of sonar yielded 3,436,118 fish detections at the wetland connection. The directional split is the arresting part: 1,739,671 detections were moving into the wetland pool, and 1,696,447 were moving out toward Crane Creek and the open lake. Within about 43,000 detections — barely more than one percent of the total — the traffic balanced. Fish were not simply pooling inside the restored habitat or draining out of it. They were cycling through it.
Intensity varied enormously hour to hour. The lowest hour-long echograms recorded as few as 3 fish; the busiest logged 9,353. That three-orders-of-magnitude spread is the specific signal that 24-hour net sets cannot resolve, and it is the reason the passage was watched continuously rather than sampled.
Year totals declined from an early peak: 1,521,316 detections in 2011, 973,453 in 2012, 511,905 in 2013, and 429,443 in 2014. The first year after reconnection was the loudest by a wide margin, consistent with a newly opened habitat being explored and exploited at high rates. But the later years are not a story of abandonment. Even the lowest annual figure represents hundreds of thousands of fish detections crossing a single narrow opening, and use of the pool continued across every year of the record. The full text, including methods and deployment details, is available through the USGS publications warehouse (DOI 10.65087/aehm.028.03.6; USGS Index ID 70275151).
What a long count buys managers
Coastal wetlands along the Great Lakes are being reconnected in pieces — dikes breached, water-control structures modified, channels reopened — on the premise that lake fish will find and use the habitat behind them. This dataset supplies a quantitative version of that premise at one site: a reconnected pool of roughly 25 acres drew millions of directional fish detections over four years, with inbound and outbound movement nearly matched.
That has practical timing consequences. If fish traffic through a passage swings from single digits to more than nine thousand fish per hour, then the scheduling of disruptive activity — water-level manipulation, dredging, construction, structure maintenance — is not a minor operational choice. It determines whether a project intersects a peak movement window or a quiet one. Continuous acoustic monitoring, unlike periodic netting, can identify those windows before the equipment arrives.
The study’s core contribution stays close to its instrument. Across 2,022 hours of sonar at one Lake Erie wetland connection, 3,436,118 fish detections were logged — 1,739,671 in, 1,696,447 out — and fish kept crossing the reopened passage in every one of the four years counted.